Automated Testing System - Statistics
I decided to pull gather some statistics about the automated testing system. These statistics were collected on Wednesday, May 6, 2009 at 4:00 AM GMT. Automatic generation of these statistics along with analysis is a feature I have in mind for ATS 2.0. I appreciate donations to the chipin (right), as this project requires a lot of development time.
From the data you can see that the test slaves have been running tests for the equivalent of 200 days. The system has been running for 192 days and not all the data was included since some of it is inaccurate. That means the system has saved 200 days of developer’s time! It is clear that the ATS is a vital part of test driven development. Additionally the time that would have been spent fixing regressions and new bugs has been drastically lowered.
| Item | Function | Value |
|---|---|---|
| Time testing | SUM | 17,310,047 seconds (~288,500 minutes, ~200 days) |
| Test run (test suite) | COUNT | 42,351 |
| MAX | 3620 seconds (~60 minutes) | |
| MIN | 17 seconds | |
| AVG | 804 seconds (~ 13 minutes) | |
| STDDEV_POP | 783 seconds (~13 minutes) | |
| Test (patch, times tested) | COUNT | 6,953 |
| MAX | 86 | |
| MIN | 1 | |
| AVG | 10 | |
| STDDEV_POP | 15 | |
| Test pass count | MAX | 11,453 |
| MIN | 0 | |
| AVG | 4,265 | |
| STDDEV_POP | 4,910 | |
| Test fail count | MAX | 6,989 |
| MIN | 0 | |
| AVG | 9 | |
| STDDEV_POP | 155 | |
| Test exception count | MAX | 813,795 |
| MIN | 0 | |
| AVG | 160 | |
| STDDEV_POP | 9,893 |
One item you may notice is the maximum test exception count of 813,795. The patch that caused that many exceptions proved that our system is scalable! The patch is much appreciated. :)
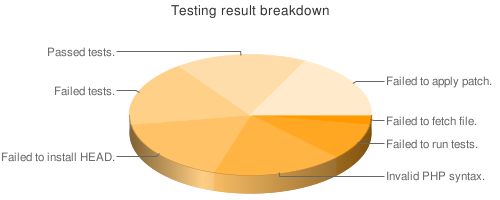
Saved the current test result breakdown.

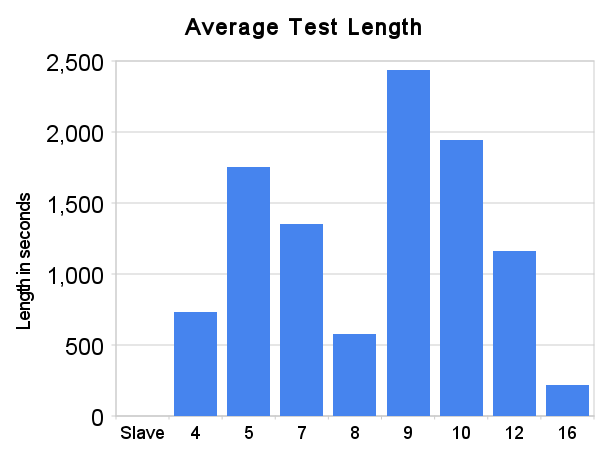
The average test run length for all the active test slaves can be seen below. This data is only looking at the latest test run for each patch in the system.
| Test slave | Average test length* |
|---|---|
| 4 | 730 seconds |
| 5 | 1,753 seconds |
| 7 | 1,352 seconds |
| 8 | 576 seconds |
| 9 | 2,438 seconds |
| 10 | 1,942 seconds |
| 12 | 1,161 seconds |
| 16 | 217 seconds |
* Excludes test runs that do not pass initial checks and fail before running test suite.
